


Abstract
CELLPEDIA is a repository database for current knowledge about human cells. It contains various types of information, such as cell morphologies, gene expression and literature references. The major role of CELLPEDIA is to provide a digital dictionary of human cells for the biomedical field, including support for the characterization of artificially generated cells in regenerative medicine. CELLPEDIA features (i) its own cell classification scheme, in which whole human cells are classified by their physical locations in addition to conventional taxonomy; and (ii) cell differentiation pathways compiled from biomedical textbooks and journal papers. Currently, human differentiated cells and stem cells are classified into 2260 and 66 cell taxonomy keys, respectively, from which 934 parent–child relationships reported in cell differentiation or transdifferentiation pathways are retrievable. As far as we know, this is the first attempt to develop a digital cell bank to function as a public resource for the accumulation of current knowledge about human cells. The CELLPEDIA homepage is freely accessible except for the data submission pages that require authentication (please send a password request to cell-info@cbrc.jp).
Database URL:http://cellpedia.cbrc.jp/
Introduction
The human body consists of more than 10 trillion cells that have highly diverse structures and functions and play specific physiological roles (1). Many histology and molecular biology textbooks state that there are ∼200 types of cells in the adult human body (2). However, this classical observation is mainly based on the morphological or histological perspective, and no cell classification system based on gene expression levels has yet been systematically established. This sometimes causes confusion in modern cell biology. Indeed, there are cells that have the same name but show different characteristics. One example is ‘fibroblasts’, which are found in multiple tissues but are known to have different characteristics, such as cell differentiation capacities, depending on their lineages and surrounding conditions (3). Similarly, the existence of different gene expression levels among cells found in slightly different locations, such as the proximal and distal parts of the colon, has been reported (4). In stem cell research, it is recently reported that only a particular group of sinusoidal endothelial cells in the bone marrow with distinct gene expression patterns regulate the properties of hematopoietic stem cells (5). Recently, several efficient strategies for such studies, including microarray and other high-throughput technologies at single-cell resolution, have been developed to detect minute differences between cells (6, 7). Gene expression analysis with these technologies may reveal the different characteristics of individual cells in the same or different tissues in the near future.
Extensive studies of cell differentiation using embryonic stem (ES) or induced pluripotent stem (iPS) cells have made remarkable progress (8, 9) and have generated cells that possess characteristics different from those of naturally occurring cells in the human body (10). Some reports have shown that several types of cells can be directly generated by reprogramming from other differentiated cells (11, 12). Therefore, a more detailed and well-structured classification system is urgently required to provide reference cells with which to characterize artificially produced cells or distinguish functionally similar but differently localized cells. In addition, there is a compelling need to accumulate and provide cell differentiation or transdifferentiation information for both naturally existing and artificially produced cells to further enhance studies of design methods or routes to produce particular types of cells.
Inspired by the importance of cell studies early on, we developed a gene expression profile data search system called ‘CellMontage’ in 2004, where we also provided a draft version of a cell catalogue (13). In the previous version, we used classical cell taxonomy and stored cell illustrations for ∼200 cell types. In CELLPEDIA, a new and detailed cell classification system is proposed by combining conventional taxonomy with physical mappings, allowing the unique identification of any naturally existing cells. With the improved taxonomy as its backbone, CELLPEDIA provides a repository for cell image, gene expression and cell differentiation data, serving as a digital dictionary of human cells for the biomedical field. This database is expected to become an increasingly important tool for cell-related research, including regenerative medicine and cell therapies, in the near future.
General features of CELLPEDIA
Database structure
The latest version of CELLPEDIA consists of two major cell categories: ‘differentiated cell’ and ‘stem cell’. The ‘differentiated cell’ category contains information of fully differentiated or mature cells that represent specific functions or characteristics, whereas the ‘stem cell’ category contains information of undifferentiated or immature cells, such as progenitor or multipotent stem cells. Each cell entry in either category contains three primary (i.e. raw) data: (i) digital images of cells and tissues; (ii) gene expression data; and (iii) journal articles on cell functions and differentiations. The cell images and the gene expression data are basically collected via submission pages from either laboratories or public data. The journal articles are manually compiled from PubMed (14) by the authors. Currently, 365 images, 878 gene expression profiles and 336 articles for ‘differentiated cell’ are registered. For ‘stem cell’, 36 images, 92 gene expression profiles and 83 articles are registered. These primary data are linked to each other by our own cell taxonomy keys (explained in the ‘Enhanced cell classification system’ section) in the relational database structure. All the three types of primary data cited above are retrievable from an integrated page, together with additional secondary information that includes (iv) image parameters regarding cell shape; (v) the Open Biomedical Ontology (OBO) Cell Type Ontology; and (vi) cell differentiation neighborhood links (Figure 1).
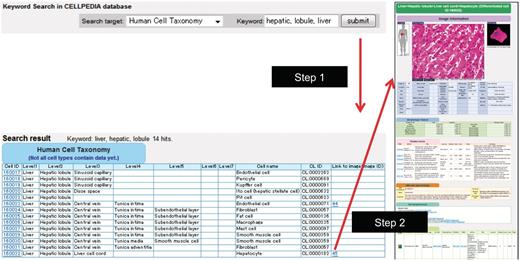
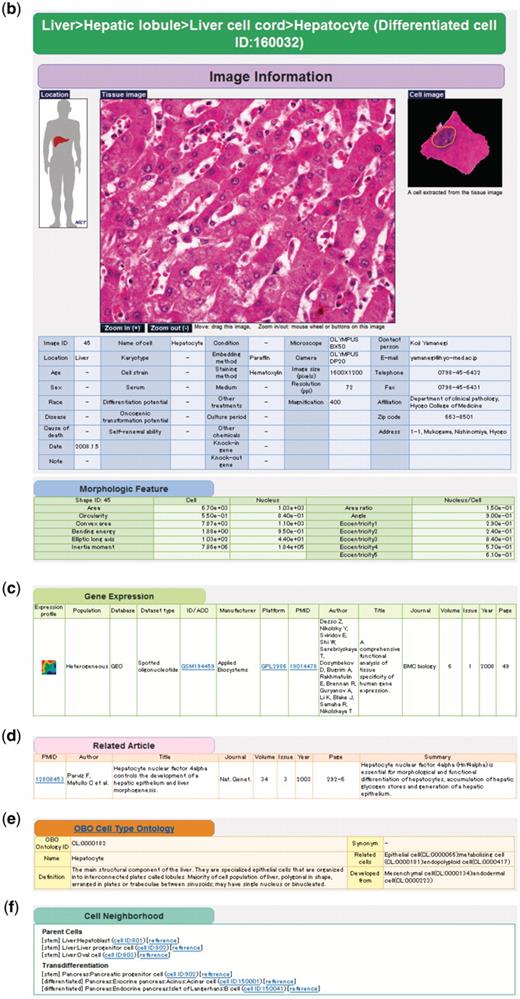
Example of keyword search and integrated page of hepatocyte (differentiated cell ID: 160032). (a) Retrieval of cell taxonomy entries by keyword search (keywords: hepatic, lobule, liver) is shown (Step 1). Clicking on an image ID in the cell taxonomy page will lead to the integrated page (Step 2). The integrated page is composed of three types of primary data: (b) digital images of cells (and tissues); (c) gene expression data; and (d) journal articles. Additional secondary information is also provided, including (b) image parameters regarding cell shape (table of morphologic features); (e) the OBO Cell Type Ontology; and (f) cell differentiation neighborhood links.
To access any data easily, a keyword search box on the top page is available for our cell taxonomy, all the primary and OBO Cell Type Ontology information cited above. Figure 1a shows an example of a search result that is queried by the keywords ‘hepatic, lobule, liver’ in the search target ‘human cell taxonomy’. A user can select a favorite entry from the list of retrieved cell types and an integrated page for the selected cell is shown by clicking the Image ID. The locations of cells or tissues are shown by voxel models of male and female human bodies provided by National Institute of Information and Communications and Technology (NICT) (15). We also provide precalculated gene modules or biclusters extracted from the collected gene expression data described above using our software program called System for Assembling Modules by Ultra Rapid Algorithm on Itemsets (SAMURAI) (16). A gene module consists of a subset of genes and a subset of experiments, and SAMURAI exhaustively extracts gene modules that share common gene expression patterns in both query and gene expression databases (17).
The CELLPEDIA database system is developed and implemented in Perl CGI script on the MySQL relational database. The current Web server runs with Apache daemon on a Linux system. The database schema is designed so that as many as 15 tables in the database can be interconnected by the backbone of the cell taxonomy keys (differentiated cell IDs or stem cell IDs) and other branch group keys, such as Image IDs, Expression IDs, etc. A simplified database schema is shown in Figure 2.
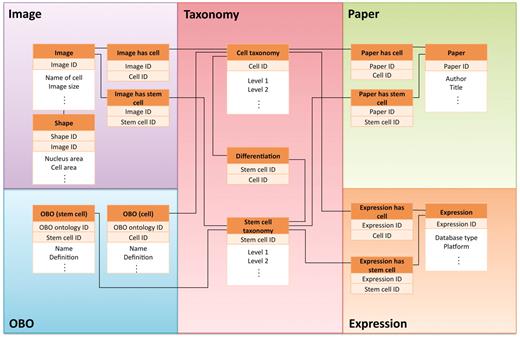
Simplified view of database schema used in CELLPEDIA. The database schema is designed so that as many as 15 tables in the database can be interconnected by the backbone of the cell taxonomy keys (differentiated cell ID or stem cell ID) and other branch group keys.
Enhanced cell classification system
In typical textbooks, cells with equivalent or similar functions are given the same name even if they exist in different physical locations. For instance, ‘goblet cells’ are found in the nose, lung and small and large intestines. Similarly, ‘fibroblasts’ exist in many connective tissues, including loose, dense and reticular tissues that have different properties. These cells may have different gene expression patterns that are attributable to various surrounding conditions (e.g. pH, ECM components, mechanical tension, etc.) (18–21). Particularly, ECM-associated molecules and their mechanical properties often influence cell shape and differentiation. These properties are particularly important in the field of regenerative medicine (22–25). Figure 3 shows two types of cells and examples of their different physical locations. Table 1 summarizes the different physical locations of six well-known cell types: fibroblast cells, smooth muscle cells, epithelial cells, endothelial cells, nerve cells and goblet cells. For example, fibroblast cells are found in as many as 297 physical locations, whereas goblet cells are found in 30 locations.
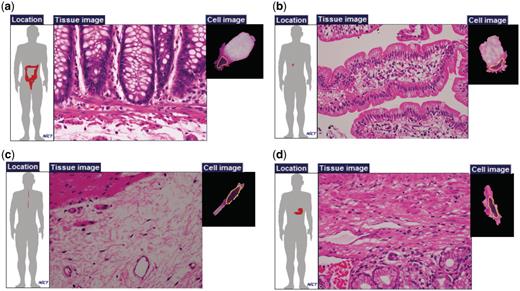
Examples of cells with the same names. Goblet cells of (a) large intestine and (b) small intestine; and fibroblasts of (c) esophageal submucosa and (d) pylorus.
Cells with the same names in different physical locations
| Cell name | Number of physical locations |
|---|---|
| Fibroblast | 297 |
| Smooth muscle | 269 |
| Epithelial | 122 |
| Endothelial | 117 |
| Nerve | 44 |
| Goblet | 30 |
CELLPEDIA defines its own enhanced cell taxonomy for physically distinct cells, establishing a hierarchical structure of up to eight levels from organs (or tissues) to cells. It presents a combination of both conventional cell taxonomy and their physical locations (Figure 1a). In total, 2260 types of differentiated human cells are listed and assigned unique cell taxonomy keys. Similarly, stem cells and progenitor cells are classified into 66 taxonomy keys. Some of the differentiated cells and stem cells are interconnected based on the cell differentiation information by taxonomy keys.
In order to verify our own hierarchical taxonomy, we use OBO UBERON (26, 27), which is a multi-species anatomy ontology, to check the agreement of classification names and structures. Among the non-redundant 551 hierarchical node terms (excluding the cell name itself) in the eight levels of CELLPEDIA taxonomy, 505 (91.7%) exactly correspond to UBERON anatomical terms. The remaining 46 terms are not found in UBERON exactly; nevertheless, most of them belong to subclass of the end terms of UBERON, i.e. they are mapped to more detailed portions of the human anatomy than those of UBERON. The 46 terms are listed in Supplementary Table S1.
We also compare the orders of hierarchical node terms for all of the 2260 differentiated cells in CELLPEDIA with those in UBERON. We find that as few as 1259 (55.7%) hierarchical paths match the OBO ‘part_of’ or ‘is_a’ relationships in the UBERON anatomical terms. The main reason for this low consistency is the vascular system; CELLPEDIA distinguishes each blood vessel according to physical location, whereas UBERON recognizes only one independent blood system. If we exclude the vascular system, as many as 1951 (86.3%) paths would match the OBO ‘part_of’ or ‘is_a’ relationships in the UBERON anatomical terms. If we allow one mismatch term in the path, almost all of the 2227 (98.5%) paths would match. From these observations, we conclude that CELLPEDIA taxonomy is highly compatible with the UBERON anatomical terms and their relationships are thus reliable and useful. Note that UBERON contains multiple paths to reach the same anatomical location from the root, whereas CELLPEDIA contains a single path to locate any cell types.
OBO cell type ontology
The OBO organization provides the ontology for ∼1500 types of cells from various organisms, including vertebrates (28). We incorporate human-related cell ontological terms into our integrated pages to provide formal names of cell types under the defined vocabulary. Currently, 2240 (99.5%) and 48 (72.7%) taxonomy keys for differentiated cells and stem cells, respectively, are linked to 269 ontological terms of OBO cell types and displayed on the integrated pages (Figure 1e).
Cell images and morphological parameters
We have collected cell images corresponding to our human cell taxonomy keys to provide visual information about the cells. The cell images are primarily collected by submission from various laboratories and manually checked by the curators for their quality and tissue origins. Currently, we have 365 images for differentiated cells and 36 images for stem cells registered in the database. Nevertheless, when we count the number of cell types containing images in a conventional way, i.e. counting the cell types excluding the redundant names, we find that 57 of a total of 170 differentiated cell types are already registered.
As the resolutions of the collected cell images vary, we provide zoom-in and zoom-out functions for the tissue images to enable the user to choose the proper scale on the integrated pages. A magnified image of the original image is also shown on the right side. Image attributes provided by the submitters, such as donor information, cell culture conditions, microscope platforms, and contact persons, are also collected. Some additional attributes for stem cells are also provided, such as types of feeder cells, differentiation ability, self-renewal ability and so on (Figure 1b). It is noteworthy that multiple images from various submitters for the same cell taxonomy key are stored to record variability in cell shape under different conditions and environments.
Currently, most of the cells in CELLPEDIA are stained with hematoxylin and eosin (HE), which is mainly used to distinguish the nucleus from the cytoplasm. Well-known cell image analyzers, such as NIH Image (29) and CellProfiler (30), recognize cell outlines very well in fluorescent images but often fail to recognize cells stained with HE. Therefore, we have developed a new tool called ‘Cytometrica’ that can more precisely detect the outlines of HE-stained cells based on a dynamic programming algorithm (Moesa,H.A., Taniguchi,T. and Fujibuchi,W., manuscript in preparation). Cytometrica is also designed to measure the image parameters of cellular and nuclear morphologies, such as the surrounding area, bending energy, inertia moment, and area ratio between the nucleus and the cell. Therefore, when a raw image is submitted to CELLPEDIA, the morphological parameters of as many cells as possible in the image are measured by the curators with Cytometrica, stored as different entries, and displayed on the integrated pages (Figure 1b).
Gene expression data
We have collected 878 sets of gene expression data for differentiated cells and 92 sets for stem cells from such public databases as the Gene Expression Omnibus (31) and ArrayExpress (32). We also provide a data submission page for gene expression data for future use. Due to limitations in the current techniques for single-cell analysis and available data, we have so far accumulated gene expression data obtained from tissues or multiple cells. To avoid confusion, we have added a ‘Population’ category in the gene expression data table to provide information of the data resource. ‘Heterogeneous’ means that the gene expression data are measured from a heterogeneous cell population. ‘Multiple’ means that the data are measured from unique but multiple cells. ‘Single’ means that the data are measured from a single cell.
To visualize our gene expression data, we generate self-organization maps using all the collected data (Figure 1c), which are cross-referenced with Entrez gene IDs. We also generate a list of genes that are up- and down-regulated in each cell type and make them available for downloading. In addition, tissues or cells with similar gene expression patterns are connected with the correlation coefficients of collected gene expression data, and in order to survey the relationships of gene expression data, the results are displayed as a minimum spanning tree in each of ‘differentiated cell’ and ‘stem cell’ top pages.
Journal articles
Reference journal articles for each cell taxonomy key are manually curated by the authors to glean existing knowledge about mammalian cells. We have so far preferentially collected articles for cells with image data only as the database is still in its infancy. We have summarized 336 papers for differentiated cells and 86 papers for stem cells, respectively, from the perspectives of cell function and differentiation. We also provide hyperlinks to corresponding entries in PubMed on the integrated pages. In CELLPEDIA, the contents of the journal articles are represented by a concise sentence incorporating the most important information, so that the user can instantly access biological functions or differentiation factors of cells (Figure 1d).
Applications of CELLPEDIA
Gene expression similarity
Although not yet available at the single-cell level, the gene expression data compiled in CELLPEDIA obviously provide important information about the gene expression profiles of cells. We have developed and maintained a matching system for gene expression data called ‘CellMontage’ in our laboratory (33), and have added the CELLPEDIA dataset to the database selection menu on the CellMontage homepage (http://cellmontage.cbrc.jp/) so that the user can check whether the expression profiles of artificially produced cells are similar to the profiles of naturally existing cells. As we consider CellMontage to be a part of CELLPEDIA project, the ‘Profile Matching’ and ‘Profile Retrieval’ pages of CellMontage are now available in the ‘Cell Analysis Tools’ in CELLPEDIA. We also plan to release a new version of CellMontage, which will allow more accurate ranking with a machine-learning-based approach (to be published elsewhere). This approach will be quite useful in predicting the characteristics of iPS cells, such as multipotency, tumorigenicity and cell stability.
Cell neighborhood
It would be useful if we could retrieve accumulated information on cell differentiation or transdifferentiation in a deductive way, to explore new pathways for the production of cells. CELLPEDIA currently provides 934 binary (parent–child) relationships involved in cell differentiation, collected from textbooks and journals, as the ‘cell neighborhood’ (Figures 1f and 4).
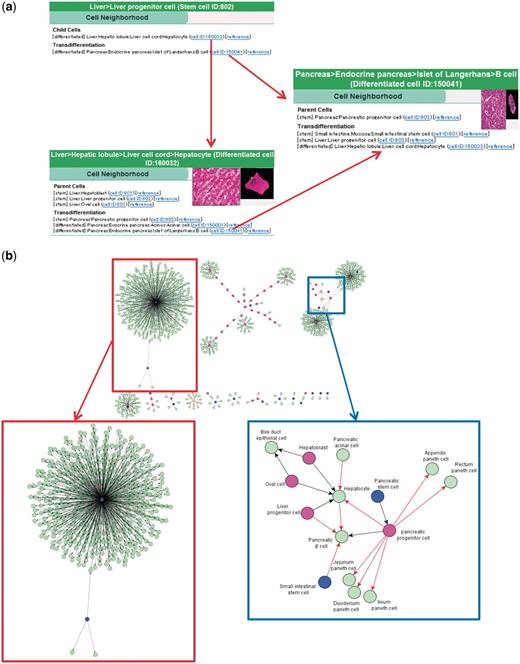
Cell neighborhood links. (a) Cell neighborhood links with the hepatocyte: cell differentiation or transdifferentiation pathways can be deductively traced. (b) Cell differentiation map constructed with 934 collected binary relationships. Circles filled with different colors indicate levels of differentiated cells (blue: stem cells, wine red: progenitor cells and light green: differentiated cells). Black and red arrows indicate differentiation and transdifferentiation pathways, respectively. The red box shows the mesenchymal stem cell cluster in a magnified view. The blue box shows a part of the endoderm cluster in a magnified view.
Figure 4a shows an example of deducing cell differentiation or transdifferentiation pathways from the integrated page of hepatocyte (differentiated cell ID: 160032) using cell neighborhood links. Three linked cells are found for both parental and transdifferentiation relationships from the hepatocyte page. It is noteworthy that distant relationships between cells can be deduced by following consecutive neighborhood links. For example, the differentiation route of liver progenitor cells to pancreatic beta cells, which is already reported (34), is determined by successively following the links from ‘liver progenitor cell (stem cell ID:802, Figure 4a top) to hepatocyte (differentiated cell ID:160032, Figure 4a bottom)’ and from ‘hepatocyte to pancreatic beta cell (differentiated cell ID:150041, Figure 4a right)’.
As an option, the cell differentiation pathway map can be visualized from the collected binary relationships using such public software as yEd Graph Editor (yWorks software, Tubingen, Germany) or graphviz (AT&T Inc, Dallas, TX, USA). Figure 4b shows an example of such a map constructed using all of the collected 934 cell differentiation and transdifferentiation data. As a result, three large clusters are recognized. The largest one (Figure 4b top left and in the red box) is a mesenchymal stem cell cluster and its differentiated cells. The rest of the clusters are hematopoietic system (Figure 4b top middle) and endoderm (Figure 4b top right) clusters. The endoderm cluster includes most of the registered endodermal tissues, such as liver, pancreas and large and small intestines. The region that contains transdifferentiation pathways (indicated by red arrows) is shown in a magnified image (Figure 4b blue box). In the future, we expect that with further accumulated binary relationship data under a new deduction system, novel differentiation pathways will be explored and experimentally verified.
Future work
The accumulation of more data of cell locations and surrounding conditions will be increasingly important for cell differentiation and regenerative medicine. We will continue to collect more data, especially about stem cells and cell neighborhoods, as well as improve the database to make it more accessible to such information in an integrative way, in order to contribute to progress in regenerative medicine. Yet unknown but more efficient transdifferentiation pathways may be found by expanding cell neighborhood links.
Furthermore, through discussions with stem cell researchers, we plan to extend our database structure to incorporate recent iPS or ES cell data generated with modern technologies, such as next-generation sequencing and mass spectrometry. RNA-Seq, chromatin remodeling, epigenetics, lectin microarray and proteomics data are possible candidates to be incorporated in future development. We will also prepare another cell category ‘cell line’ and collect related data because requests are often received from biomedical researchers and pharmaceutical industries. Although this is a long-term goal, we also plan to collect pathological images and information about diseases, such as various types of cancers, in the future version of CELLPEDIA, to help in the analysis of disease mechanisms.
Regarding the technical aspect of the database system, we plan to provide a Web page for data downloading to obtain whole data for each cell type. Similarly, we plan to develop an application programming interface, or API, to provide CELLPEDIA entries more efficiently at the request of some pharmaceutical companies.
Availability
CELLPEDIA is freely available for academic and personal use. Commercial users are required to obtain a license when any data of CELLPEDIA are used to generate secondary products.
Funding
AIST Research Information Database (RIO-DB) team in part. Funding for open access charge: 2011 AIST Management Expenses Grants.
Conflict of interest. None declared.
Ackowledgements
The authors wish to thank Dr Makoto Asashima and Dr Hiroshi Kuriyama of Advanced Industrial Science and Technology for useful discussions on iPS and ES cell data. The authors also thank Dr Kaoru Mogushi of Tokyo Medical and Dental University for critical reading the manuscript.
