


Abstract
SalmonDB is a new multiorganism database containing EST sequences from Salmo salar, Oncorhynchus mykiss and the whole genome sequence of Danio rerio, Gasterosteus aculeatus, Tetraodon nigroviridis, Oryzias latipes and Takifugu rubripes, built with core components from GMOD project, GOPArc system and the BioMart project. The information provided by this resource includes Gene Ontology terms, metabolic pathways, SNP prediction, CDS prediction, orthologs prediction, several precalculated BLAST searches and domains. It also provides a BLAST server for matching user-provided sequences to any of the databases and an advanced query tool (BioMart) that allows easy browsing of EST databases with user-defined criteria. These tools make SalmonDB database a valuable resource for researchers searching for transcripts and genomic information regarding S. salar and other salmonid species. The database is expected to grow in the near feature, particularly with the S. salar genome sequencing project.
Database URL:http://genomicasalmones.dim.uchile.cl/
Introduction
Atlantic salmon (Salmo salar) and Rainbow trout (Oncorhynchus mykiss) are some of the fish of importance in aquaculture that have been studied extensively from a biological perspective. Furthermore, scientific interest as a model species has generated research in various aspects such as genetics, physiology, immunology and ecology, among others. This large amount of information has been enriched by the significant increase in genomic research (1).
Several projects and sequencing efforts have produced important genomic resources such as BAC libraries (2), physical (3) and genetic maps (4–6) and ESTs from different stages and tissues from salmon (7, 8). These studies have allowed the search of putative genetic markers such as Single Nucleotide Polymorphism (SNP) (9) and micro-satellites (10, 11), the development of DNA microarrays for the global analysis of gene expression (7, 12, 13) and the identification of candidate genes for multiple studies (14, 15). This information has been made publicly available through submissions to NCBI and in publicly accessible websites (16–18). This large amount of salmon EST data represents an opportunity for bioinformatics to explore and make this information available to the scientific community. Together, all these resources complement the sequencing projects for salmon species (8), in particular the upcoming Atlantic salmon genome (1).
A major challenge in genomic studies of Atlantic salmon and Rainbow trout is the complexity of their genomes due to a recent whole genome duplication event (19) and the presence of a large number of repeated elements in their genome (20). The common ancestor of salmonids experienced a genome duplication event 25–120 million years ago (19) yielding to a 6–7% nucleotide similarity between paralogous pairs (21). One strategy that helps to understand the architecture and function of these complex genomes is to apply comparative genomics, using available sequenced genomes of related species such as zebrafish (Danio rerio), medaka (Oryzias latipes) (22) and fugu (Takifugu rubripes) (23). In order to facilitate these studies, we have developed SalmonDB, a database which includes unigenes from EST data, functional annotation of putative CoDing Sequences (CDS), orthology relationship to other fish genomes, mapping information to metabolic pathways, tools for primer design and flexible data query, among others.
SalmonDB architecture
SalmonDB was built based on the GBrowse genome viewer—a component of the GMOD project (24)—, the BioMart project (25) and the GOParc ontology and pathways architecture tool, which are part of the GENDB (26) genome annotation system.
GBrowse is a widely used tool for visualization of genome annotations through a web interface. GBrowse was implemented to show unigenes or chromosome features related to blast results, protein domains and SNP predictions. The database backend is implemented in MySQL using the Bio::DB::SeqFeature::Store scheme from the BioPerl project.
In order to perform data mining of our website, an easy-to-use Biomart interface was implemented. BioMart was developed recently and it has now become a fully generic data integration tool. Some model organism databases, such as Ensembl, EBI or InterPro, have implemented it in their websites to simplify the access to their large datasets. We developed a Perl object that takes a Bio::DB::SeqFeture::Store scheme to populate a biomart scheme. Then, we used the BioMart developing tools (Marteditor, MartBuilder and Martrunner) to configure our interface.
Also, to provide visualization of the metabolic pathways and gene ontology, we modified the GOParc code to perform queries to a Bio::DB::SeqFeature::Store database that stores the information related to EC Numbers (pathway data) and GO Numbers (Gene Onotology data).
SalmonDB is based on a modular architechture that allows us to integrate new upcoming tools or informations related to salmonids or other aquaculture species easily.
SalmonDB contents
SalmonDB collects unigene sequences for Atlantic salmon and Rainbow trout. It also stores annotated genome sequences of zebrafish, fugu, stickleback, medaka and pufferfish, which allows inter-species comparison studies.
The current dataset release is based on 495 257 S. salar ESTs and 285 359 O. mykiss ESTs collected from 93 libraries including different tissues, developmental stages and treatments, downloaded from the public NCBI EST database [GRASP consortium generated most of these data (27)]. The genome sequences and annotations for the other aquaculture species were downloaded from the Ensembl database.
Both EST datasets were processed using an in-house developed workflow, shown in Figure 1, which is divided in three phases: Phase I was dedicated to EST preprocessing and assembly, Phase II was focused on sequence annotation and feature identification and in phase III all results were stored in the SalmonDB database.
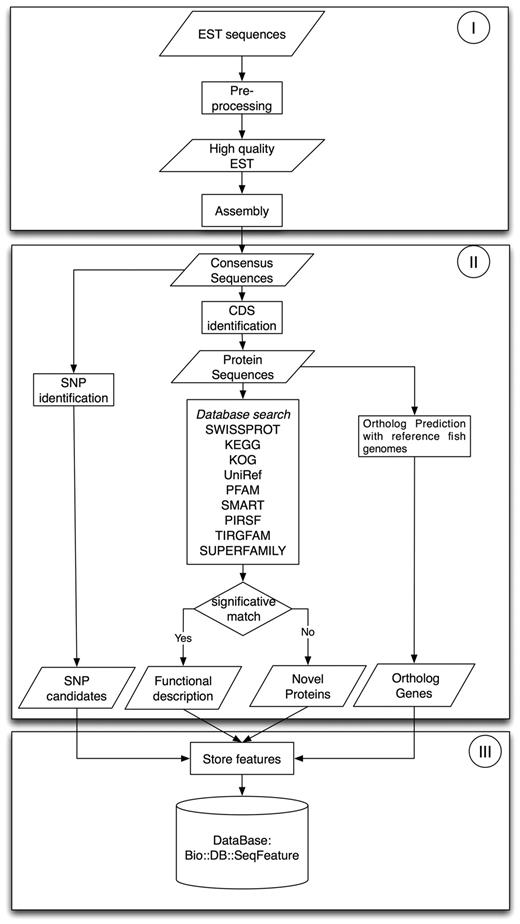
EST workflow: Phase I is preprocessing and assembly; Phase II, sequence annotation and characterization and Phase III, storage of biological information.
Phase I required three programs: Seqclean (28), CAP3 (29) and BLAST (30), which were run to convert raw EST sequences into unigenes. SeqClean was used to remove vector sequences using NCBI's Univec database, Poly-A tails, low-quality segments at the 5′ and 3′ cDNA ends and low complexity regions. All ESTs under 100 bp were discarded. We used CAP3 to assemble high-quality EST sequences sharing over 95% identity over a region >50 bp. Then, we used BLASTN for an all against all contigs and singletons local alignment. We regrouped all sequences sharing over 95% of identity and at least 70% of coverage given from the blast output. Then, we re-assembled all the new groups using CAP3 with the same parameters used in the first assembly step. The assembly information is summarized in Table 1.
Final assembly details
| Assembly statistics | Salmo salar | Oncorhynchus mykiss |
|---|---|---|
| Number of total reads | 495 257 | 285 359 |
| Total Unigenes in first assembly | 150 720 | 125 077 |
| Total Unigenes in reassembly (BLAST-CAP3) | 103 221 | 97 667 |
| Total Unigenes after CDS prediction | 59 336 | 62 233 |
| Number of reads in final assembly | 387 294 | 213 218 |
| Number of singletons | 31 915 | 38 884 |
| Average read length | 619 | 666 |
| Unigene length (average ± SD) | 872 ± 434 | 880 ± 322 |
| Average unigene depth | 7 | 3 |
| Maximum unigene depth | 2005 | 1444 |
Total number of reads and unigenes assembled using the described pipeline.
In Phase II, unigenes were analyzed to annotate putative protein products and to identify sequence features. First, all unigenes were analyzed with a BLASTX search against the Uniref (31) database to predict putative CDS and to determine the percentage of full-length cDNA contained in it. The CDS was assigned when the unigene had a significative hit (E < 1E − 10). Unigenes without a significant hit against the Uniref database were further analyzed using ESTscan (32). Putative CDS having at least 30 aminoacids were included in the database, the rest was discarded.
The functional annotation was based on homology detection with known proteins using MPIBLAST (33) searches against Uniref (31), Swissprot (34), KEGG (35) and KOG (36) databases. To improve the functional assignment and classification, we used MPIHMMER against PFAM (37), SMART (38), TIGRFAM (39), SUPERFAMILY (40) and PIRSF (41) databases to search for motifs in all unigenes. Motifs were assigned when a domain was detected with an E < 10−5.
Putative SNPs within sequences in the assembly were detected using the AMOS toolkit (42) and in-house developed scripts optimized for SNP discovery in complex genomes. Those sites within CDS regions, with more than four covering reads, that differ at least 20% from the consensus sequence and that were not inside repetitive sequences were marked as putative SNPs. Also, non-synonymous alleles and protein positions were predicted for each SNP.
Finally, we used Orthomcl (43) clustering to predict orthologs between the reference fish genomes and the salmonid species. A total of 273 395 proteins were clustered with Orthomcl using an E-value cutoff of 10−10 and a moderate inflation value of 2.5. The analysis produced a total of 28 365 clusters, where only the ortholog and paralog clusters containing salmonid species were stored in the database.
In Phase III, all sequence features were stored in MySQL as Bio::SeqFeatureI objects, cross-referenced to the corresponding external databases. Cross-references include EC, KO and KOG numbers for the Blast hits, and SMART, PIRSF, SUPERFAMILY, TIGRFAM, PFAM, INTERPRO and GO numbers for HMMER domain hits. The idea was to create a controlled vocabulary useful in other applications. A summary of SalmonDB contents is shown in Table 2.
General SalmonDB statistics
| Database | Salmo salar | Oncorhynchus mykiss |
|---|---|---|
| Unigenes | 59 336 | 62 233 |
| Total SNP | 35 879 | 42 238 |
| UNIREF | 50 067 | 52 351 |
| KEGG | 30 085 | 31 908 |
| SWISSPROT | 41 472 | 44 803 |
| KOG | 33 000 | 35 436 |
| PFAM | 20 625 | 22 306 |
| TIGRFAM | 3191 | 3715 |
| SMART | 10 493 | 11 088 |
| PIRSF | 1658 | 1978 |
| SUPERFAMILY | 24 394 | 25 447 |
Total number of unigenes matching a database hit. On average each S. salar unigene has 4.2 attributes, while O. mykiss unigenes have 4.4.
Using SalmonDB
The database can be accessed through a web interface as seen in Figure 2. The main views are the Unigene, Genome, GO and KEGG browsers, the Blast server and the BioMart interface. It also has a help navigation page that explains step by step how to use the different tools in the website.
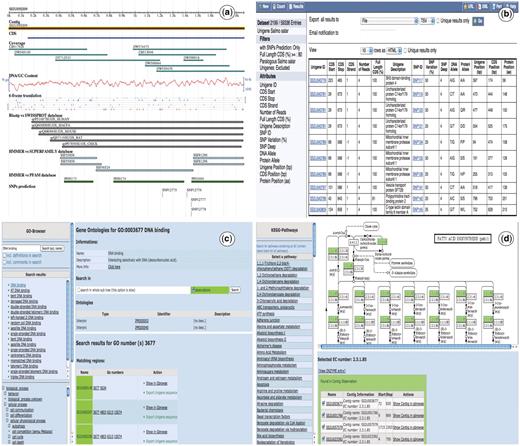
Snapshots of the SalmonDB web interface. (a) Unigene browser: the Unigene SS2U057650 is shown with several tracks (features), the blast alignment can be shown for each hit. (b) Biomart: the MartView interface is shown using the S. salar dataset and several filters selected on the left navigation panel. It also shows the ouptut table with multiple attributes shown on the left. (c) Go Browser: result of the search for GO term GO:003872 in the S. salar Unigene database. (d) KEGG Browser: the pathway associated to alanine and aspartate metabolism is shown using the S. salar Unigene database.
The Unigene Browser (Figure 2a) contains different sequence features, including CDS prediction, unigene coverage, BLAST and HMMER hits, GC content and putative SNPs, each presented as GBrowse tracks. The Genome Browser includes the complete D. rerio, O. latipes, T. rubripes, G. aculeatus and T. nigroviridis genomes and shows the genomic localization of genes, the exon/intron organization and their corresponding transcripts. Every genome contains external links to the Ensembl database for more detail. SalmonDB provides access to KEGG pathway information, through a KEGG Browser (Figure 2d), where you can select a specific EC number or browse through any pathway to find all participating unigenes. This is useful for mapping the relationships within a whole system of annotated enzymes. It is specially valuable for those who are interested in biological pathways. Moreover, SalmonDB could be queried for Gene Ontologies using the GO Browser (Figure 2c).
A web form allows the use of BLAST to find matches to an user-supplied sequence in the SalmonDB unigene databases (S. salar, O. mykiss) or the SalmonDB reference genome databases (one can search against the genome, the mRNA dataset or peptide dataset from any of the aquaculture species stored in SalmonDB). The BLAST output is dynamically linked to the Unigene and Genome Browsers (Figure 2).
BioMart (Figure 2b) is an outstanding feature for SalmonDB. It provides a step by step interface that allows searching the entire database with predefined criteria. It has the advantage that one can select any data filter combination and access only the information needed by clicking on those attributes. It is fast and depends on the information stored in the local database. Complex questions can be solved through a simple query. As an example, suppose that a researcher wants to find all unigenes participating in the nutrient reservoir activity metabolism (they all share a specific GO number, GO:0045735) and that contain a putative SNP within their sequence. First, one would click on the GO filter and specify GO:0045735 number. The next step is to click on the ‘SNP predicted only’ filter to search for just those unigenes that have a SNP present. The search will return an output table with all unigene hits and the information that was selected in the attributes form. This information can be useful to identify potential SNP markers associated to dietary responses related to nutrient storage in salmons. The website has a step by step help navigation page for using BioMart in more detail. Recently, SalmonDB biomart has been included as part of the central biomart portal (44).
Additionally, database searches can be performed with a keyword term, accession number or any ID from the cross reference of the databases mentioned before by entering the term in the quick box search or in the Gbrowse search box.
The other available databases rely on EST assembly and gene annotation data (17, 18), or the physical map based on BAC fingerprinting with BAC end sequence data (16). A comparison of the assemblies based on percent similarity among the final number of unigenes is shown on Figure 3. This plot shows the expected peak for a recent genome duplication event (45). Also, the complementary capabilities of each database and assembly statistics such as percent full-length cDNAs are shown in Tables 3 and 4, respectively.
![Frequency of aligned Unigenes plotted against percent identity. Figure (modified from [45]) shows frequency of top-pairwise alignment (E < 1e-10; query and subject coverage = 0.9) between Unigenes generated through our assembly pipeline plotted against identity score (SalmonDB, orange). It also shows the relationships among the contig consensus sequences of gene index EST assembly (Gene Index, blue) and cGRASP EST assembly (CGRASP, yellow) for Atlantic salmon. The same analysis is included for Fugu (Takifugu rubripes, light blue) and Medaka (Oryzias latipes, dark red) mRNAs obtained from Ensembl and the African Clawed Frog (Xenopus laevis, green) Unigenes obtained from NCBI. Since there is no standard metodolgy to compare EST assemblies (e.g. Genome assembly has N50 value), a good approximation is to observe the expected pattern for a duplicated genome using this strategy. We include the African clawed frog because it has a well-documented recent genome duplication. The expected pattern is shown in the figure with a peak around 93–94%. The same is expected for Salmon which suffered from a whole genome duplication ∼100 million years ago. SalmonDB and gene index assembly show these accumulation of paralogs around 93–94% identity.](https://oup.silverchair-cdn.com/oup/backfile/Content_public/Journal/database/2011/10.1093/database/bar050/2/m_bar050f3.jpeg?Expires=1781757204&Signature=oyzqpQ8MbPKPaVTW0rwNqE30ICQwat1zadZ33epKJKFJWADRYfJAYmOJymsdfJfbE1G3~1JI8W~zzw3D5reiJS6aguV8Yn4uQ22ePCgVHaXlzSOUbJCrleL9-0SuqYX5~blRx7NIjbcapeaYBdAh2aiwxXeedks14vDMNEBxcujAL7yHxca30RvNrPrI~oCIdMQN8WcKpqI~2rWTt42sebXwn232cWhEH6hy4hzPYM34DVk34OXKu4jZNaRYXCuhO98jEvqWCfXw~28tM3pQBy0Cw0-VKz1qr8SjmFZ9uR9BzfhDOUBlumAr9d-1Vz8j6C2n8NwfE0a4QRuHWptnVg__&Key-Pair-Id=APKAIE5G5CRDK6RD3PGA)
Frequency of aligned Unigenes plotted against percent identity. Figure (modified from [45]) shows frequency of top-pairwise alignment (E < 1e-10; query and subject coverage = 0.9) between Unigenes generated through our assembly pipeline plotted against identity score (SalmonDB, orange). It also shows the relationships among the contig consensus sequences of gene index EST assembly (Gene Index, blue) and cGRASP EST assembly (CGRASP, yellow) for Atlantic salmon. The same analysis is included for Fugu (Takifugu rubripes, light blue) and Medaka (Oryzias latipes, dark red) mRNAs obtained from Ensembl and the African Clawed Frog (Xenopus laevis, green) Unigenes obtained from NCBI. Since there is no standard metodolgy to compare EST assemblies (e.g. Genome assembly has N50 value), a good approximation is to observe the expected pattern for a duplicated genome using this strategy. We include the African clawed frog because it has a well-documented recent genome duplication. The expected pattern is shown in the figure with a peak around 93–94%. The same is expected for Salmon which suffered from a whole genome duplication ∼100 million years ago. SalmonDB and gene index assembly show these accumulation of paralogs around 93–94% identity.
Global comparison of available salmon databases
| SalmonDB | GRASP | ASALBASE | Gene index | |
|---|---|---|---|---|
| Data | ||||
| Data source | All public ESTs | Public ESTs, BAC ends | BAC clones, BAC ends and EST cluster | NCBI ESTs |
| Base pair quality | No | Yes | No | No |
| EST assembly | CAP3, clustering | Phrap | No | Clustering, CAP3 |
| Physical map | No | No | Yes | No |
| Genetic map | No | No | Yes | No |
| Expression data | No | Yes | No | No |
| Tools | ||||
| Blast homology search | Yes | Yes | No | Yes |
| Quick search box | Yes | No | Yes | No |
| Primer design | Yes | No | No | No |
| RepeatMasking | No | Yes | No | No |
| GO annotation browser | Yes | No | No | Yes |
| KEGG annotation browser | Yes | No | No | Yes |
| Advanced search with Biomart | Yes | No | No | No |
| Analysis | ||||
| Ortholog prediction | Yes | Yes | Yes | No |
| Paralog prediction | Yes | No | No | No |
| SNP prediction | Yes | No | No | Yes |
| CDS prediction | Yes | Yes | No | Yes |
| Other markers | No | No | Yes | No |
| Full-length cDNA prediction | Yes | Yes | Yes | No |
| Alternative splicing forms prediction | No | No | No | Yes |
| Others | ||||
| Web interface | Gbrowse | Gbrowse | Gbrowse, custom | custom |
| Other organism data | 5 fish species | Other salmonids and salmon lice | 4 fish species and Human | Other TIGR organisms |
cGRASP information was extracted directly from the http://web.uvic.ca/grasp/ website that includes features from external links. Gene index information was obtained from the website http://compbio.dfci.harvard.edu/tgi/.
Assembly statistics comparison of available salmon databases
| SalmonDB | Gene index | cGRASP | |
|---|---|---|---|
| Unigenes | 59 336 | 99 285 | 81 236 |
| Total length (Mb) | 51 | 84 | 71 |
| Min length | 100 | 100 | 75 |
| Max length | 4563 | 5828 | 4780 |
| Average length | 872 | 854 | 881 |
| Median length | 771 | 755 | 758 |
| Full-length cDNA | 5939a | 7124 | 7625 |
| % Full-length protein | 10.01 | 7.18 | 9.39 |
Table shows statistics for the three Atlantic salmon assemblies. Total number of unigenes constructed using each database pipeline, total sequence length from all unigenes and their statistics. Also, we show the number of full-length cDNAs calculated using blastx against nr database (counted as full-length when the unigene cover 99% or more of the protein).
aNumber of full-length cDNAs from SalmonDB biomart is 7465. This number was calculated using translated sequences (blastp) instead of blastx against nr.
SalmonDB is intended to fully exploit genetic information regarding salmon and provides several tools and pre-calculated analyzed data that can be easily browsed through the BioMart interface. It is also possible to perform fast comparative genomic research with other salmon databases and fish reference genomes. Among several tools, it is possible to design primers within salmon sequences and search for these primer sequences in the other genomes. This could enable an effective comparison of intron/exon boundaries among salmon and other fishes. Among other important features, SalmonDB provides with several putative SNPs that are accessible for all scientific community in order to validate and use them for genotyping experiments. All these combined information can help the researcher to conduct experiments and, therefore, improve results.
Future development of SalmonDB
In the near future, we will incorporate genomic information provided from the Atlantic salmon genome sequencing project (1) and publicly available transcriptomic data from Illumina/Solexa or Roche/454 sequences (46).
We expect to incorporate additional tools in order to allow scientists to explore the genetic and physical maps of S. salar. Also, we are integrating our database with the existing resources for salmonids using cross references to Gene Index TCs and cGRASP unigenes. Therefore, a link between similar unigenes (98% identity and 95% coverage for both sequences) will be provided in order to navigate through the different databases.
Several ongoing projects on salmon require an easy to access database with several tools available. Next-generation sequencing technologies will bust up the amount of information related to sequences. Thus, our experience in constructing databases (44, 47), NGS pipeline development and SNP discovery for salmon sequences will alow us to build a new version of the database every year with the goal of providing up to date information to end users.
Finally, Chile is part of the International Collaboration to sequence the Atlantic Salmon Genome (ICSASG) (1). Thus, the access to data will allow us to exploit different pipelines, tools and methodologies regarding salmon genome sequences. In the future, our goal is to become an important reference database for the salmonid species.
Funding
The development, creation and hosting of SalmonDB was supported by CORFO-INNOVA (grant 07CN13PBT-41); Fondecyt (1110427) and Fondap (No 15090007); Basal Grant CMM Projects. Funding for open access charge: Fondap (No 15090007).
Conflict of interest. None declared.
Acknowledgements
We would like to thank Dr William Davidson for his comments on the first manuscript.
