-
PDF
- Split View
-
Views
-
Cite
Cite
Satoko Yamamoto, Noriko Sakai, Hiromi Nakamura, Hiroshi Fukagawa, Ken Fukuda, Toshihisa Takagi, INOH: ontology-based highly structured database of signal transduction pathways, Database, Volume 2011, 2011, bar052, https://doi.org/10.1093/database/bar052
Close - Share Icon Share
Abstract
The Integrating Network Objects with Hierarchies (INOH) database is a highly structured, manually curated database of signal transduction pathways including Mammalia, Xenopus laevis, Drosophila melanogaster, Caenorhabditis elegans and canonical. Since most pathway knowledge resides in scientific articles, the database focuses on curating and encoding textual knowledge into a machine-processable form. We use a hierarchical pathway representation model with a compound graph, and every pathway component in the INOH database is annotated by a set of uniquely developed ontologies. Finally, we developed the Similarity Search using the combination of a compound graph and hierarchical ontologies. The INOH database is to be a good resource for many users who want to analyze a large protein network. INOH ontologies and 73 signal transduction and 29 metabolic pathway diagrams (including over 6155 interactions and 3395 protein entities) are freely available in INOH XML and BioPAX formats.
Database URL: http://www.inoh.org/
Introduction
Although over 300 pathway resources are listed at the Pathguide (1), only a small number provide curated signal transduction pathways in computer-readable formats, and even less support standard formats such as BioPAX (2), PSI-MI (3) and SBML (4). Signal transduction pathways require wider coverage of concepts compared to metabolic pathways or protein–protein interactions. To relate physical entities and their molecular interactions to various levels of biological phenomena, for example, cell cycle, apoptosis, organism development, immune response and disease, we need a framework for handling multiple processes in different granularities. Against this background, we use a compound graph (5) and our unique ontologies in the INOH format (6, 7), and we also cooperate with the members of the BioPAX community in establishing a pathway description standard format.
The Integrating Network Objects with Hierarchies (INOH) database differs from other related pathway databases, such as Reactome (8), Nature Pathway Interaction Database (PID) (9), PANTHER (10), STKE (11), NetPath (12) and KEGG (13), in the following points (see Table 1 for a comparison of the INOH database with other publicly accessible signal transduction pathway databases).
| . | . | INOHa . | Reactomeb . | PIDc . | PANTHERd . | STKEe . | NetPathf . | KEGGg . | Biocartah . |
|---|---|---|---|---|---|---|---|---|---|
| Knowledge Computerization | Molecular information | Yes | Yes | Yes | Yes | Yes | Yes | Yes | Yes |
| Interaction type | Yes | Yes | Yes | Yes | Yes | Yes | Yes | No | |
| Molecular complex | Yes | Yes | Yes | Yes | Yes | No | No | No | |
| Protein modification | Yes | Yes | Yes | Yes | No | No | No | No | |
| Subpathway | Yes | Yes | Yes | No | No | No | No | No | |
| Regulation of pathway | Yes | Yes | No | No | No | No | No | No | |
| Binding topology | Yes | No | No | No | No | No | No | No | |
| Generalization of molecules | Yes | Yes | Yes | Yes | Yes | No | Yes | No | |
| Generalization of events | Yes | No | No | No | Yes | No | No | No | |
| Statistics | Pathways | 102 | 54 | 124 | 165 | 84 | 20 | 389 | 254 |
| Proteins | 3395 | 5234 | 2556 | 2408 | 1545 | 1682 | 6 372 510 | 2391 | |
| Interactions | 6155 | 4247 | 8482 | 5072 | 3313 | 1800 | 8453 | 5368 | |
| Ontologies | Yes | No | No | Yes | No | No | Yes | No | |
| Literature references for | Pathway, interaction, PTM and more. | Pathway, interaction | Interaction | Pathway | Pathway, interaction | Interaction | Pathway | Pathway | |
| Data availability | BioPAX, INOH XML | BioPAX, SBML | BioPAX, PID XML | BioPAX, SBML | SBML | BioPAX, PSI-MI, SBML | KGML | N/A | |
aData from http://www.inoh.org/ (as of March 22, 2011). Pathway: number of Diagrams; protein: number of the UniProt ID links; interaction: number of the “Interaction” instances in BioPAX level3.
bData from http://www.reactome.org/ (as of March 15, 2011). Pathway: number of human pathways. Protein, interaction: http://www.reactome.org/stats.html
cData from http://pid.nci.nih.gov/ (as of March 08, 2011). Pathway, interaction: number of curated by NCI-Nature; protein: number of the UniProt ID links.
dData from http://www.pantherdb.org/pathway/ (as of July 13, 2010). Pathway, protein: ftp://ftp.pantherdb.org/pathway/current_release/README; interaction: number of the ‘Interaction’ instances in BioPAX level3.
eData from http://stke.sciencemag.org/ (as of September 16, 2010). Pathway, protein: http://stke.sciencemag.org/cm/; interaction: number of ‘reaction tag’ in SBML.
fData from http://www.netpath.org/ (as of March 18, 2011). Pathway, protein, interaction: http://www.netpath.org/
gData from http://www.genome.jp/kegg/pathway.html (as of March 30, 2011). Pathway, protein, interaction: http://www.genome.jp/kegg/docs/statistics.html
hData from http://pid.nci.nih.gov/download.shtml (as of March 08, 2011). Pathway, protein, interaction: number of instances of BioPAX level2.
| . | . | INOHa . | Reactomeb . | PIDc . | PANTHERd . | STKEe . | NetPathf . | KEGGg . | Biocartah . |
|---|---|---|---|---|---|---|---|---|---|
| Knowledge Computerization | Molecular information | Yes | Yes | Yes | Yes | Yes | Yes | Yes | Yes |
| Interaction type | Yes | Yes | Yes | Yes | Yes | Yes | Yes | No | |
| Molecular complex | Yes | Yes | Yes | Yes | Yes | No | No | No | |
| Protein modification | Yes | Yes | Yes | Yes | No | No | No | No | |
| Subpathway | Yes | Yes | Yes | No | No | No | No | No | |
| Regulation of pathway | Yes | Yes | No | No | No | No | No | No | |
| Binding topology | Yes | No | No | No | No | No | No | No | |
| Generalization of molecules | Yes | Yes | Yes | Yes | Yes | No | Yes | No | |
| Generalization of events | Yes | No | No | No | Yes | No | No | No | |
| Statistics | Pathways | 102 | 54 | 124 | 165 | 84 | 20 | 389 | 254 |
| Proteins | 3395 | 5234 | 2556 | 2408 | 1545 | 1682 | 6 372 510 | 2391 | |
| Interactions | 6155 | 4247 | 8482 | 5072 | 3313 | 1800 | 8453 | 5368 | |
| Ontologies | Yes | No | No | Yes | No | No | Yes | No | |
| Literature references for | Pathway, interaction, PTM and more. | Pathway, interaction | Interaction | Pathway | Pathway, interaction | Interaction | Pathway | Pathway | |
| Data availability | BioPAX, INOH XML | BioPAX, SBML | BioPAX, PID XML | BioPAX, SBML | SBML | BioPAX, PSI-MI, SBML | KGML | N/A | |
aData from http://www.inoh.org/ (as of March 22, 2011). Pathway: number of Diagrams; protein: number of the UniProt ID links; interaction: number of the “Interaction” instances in BioPAX level3.
bData from http://www.reactome.org/ (as of March 15, 2011). Pathway: number of human pathways. Protein, interaction: http://www.reactome.org/stats.html
cData from http://pid.nci.nih.gov/ (as of March 08, 2011). Pathway, interaction: number of curated by NCI-Nature; protein: number of the UniProt ID links.
dData from http://www.pantherdb.org/pathway/ (as of July 13, 2010). Pathway, protein: ftp://ftp.pantherdb.org/pathway/current_release/README; interaction: number of the ‘Interaction’ instances in BioPAX level3.
eData from http://stke.sciencemag.org/ (as of September 16, 2010). Pathway, protein: http://stke.sciencemag.org/cm/; interaction: number of ‘reaction tag’ in SBML.
fData from http://www.netpath.org/ (as of March 18, 2011). Pathway, protein, interaction: http://www.netpath.org/
gData from http://www.genome.jp/kegg/pathway.html (as of March 30, 2011). Pathway, protein, interaction: http://www.genome.jp/kegg/docs/statistics.html
hData from http://pid.nci.nih.gov/download.shtml (as of March 08, 2011). Pathway, protein, interaction: number of instances of BioPAX level2.
First, the INOH database uses a hierarchical, event-centric data model with a compound graph. It focuses on biological processes at various levels and is based on a compound graph, an extension of graph-based representation. A compound graph is a hierarchical graph in which each node can recursively contain a graph inside itself. This feature makes a compound graph suitable for subpathways and molecular complex annotations in biological pathway representation and is useful for managing complexity by interactively dividing a pathway into distinct components or modules (5, 14).
Second, the INOH database has a set of literature-based ontologies for pathway annotation to precisely define the names of pathway components and properties and to ease data integration. To provide machine-accessible pathway knowledge that resides in scientific literature, encoding the topological structure of pathways is not sufficient. For example, it is not easy to automatically specify a single sequence identity for each molecule name that appears in the scientific literature. A molecule name may stand for concepts of various granularities, from concrete objects, such as human ERK1, to generic concepts or categories such as MAPK or kinase. Usually, biologists have the appropriate background knowledge and know that ERK1 is an MAPK. However, computer systems have no such background knowledge. By annotating only the names of molecules, the relation between ERK1 and MAPK is lost. Hence, background knowledge that biologists use to interpret pathway diagrams has to be made explicit and available to computers with well-defined, hierarchical ontologies.
Third, the INOH database has many pathway descriptions as a structured format, such as protein modification residues, binding sites, protein complex topologies, molecular localizations, reaction orders and pathway modules with literature references (Table 1). For example, the binding between phosphorylated tyrosine and SH2 domains is an important signal transduction event. However, many databases, including Reactome and STKE, store this information as definitions or comments in the free text format. We modeled this information as protein properties and an edge connecting them. Furthermore, we provided a good example for determining the BioPAX level 3 format, which includes the information of molecular states and binding topologies.
Finally, we developed the graph query Similarity Search using the combination of a compound graph and ontologies. The search results may include unexpected pathways due to searching up and down the INOH ontology's hierarchy. This is the most unique feature that other databases or ontologies have never achieved.
Data model
Event-centric data model with compound graph
The INOH data model is shown in Figure 1. In the INOH database, ‘event’ means pathways, subpathways or black-box processes whose internal components are not provided (macroprocesses such as apoptosis or as-yet-unknown processes on the molecular level). A minimum unit of an INOH event consists of input/output/controller molecules (proteins, chemical compounds, DNA, RNA and complexes) and their interactions (binding, phosphorylation, translocation and transcription). An INOH pathway consists of a series of these units. In Figure 2, each rectangle is a node (compound node) of this compound graph, and these compound nodes have a graph inside them. The pathway consists of several events (subpathways) and each minimum unit of events has its own interactions. The output molecules of the event are then ‘passed’ to the next event as inputs.
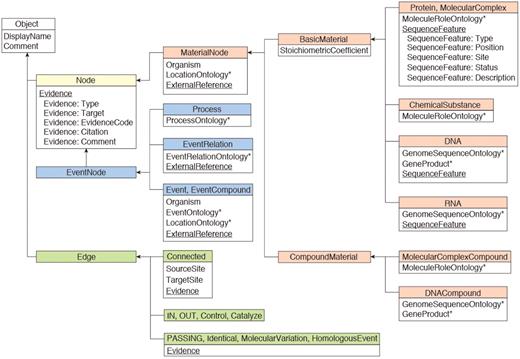
INOH data model. Boxes represent class objects (nodes and edges) and their attribute(s), and arrows show inheritance relationships. Multiple values are allowed at underlined attributes. Asterisks indicate that the value for the attribute is filled from INOH ontology terms.
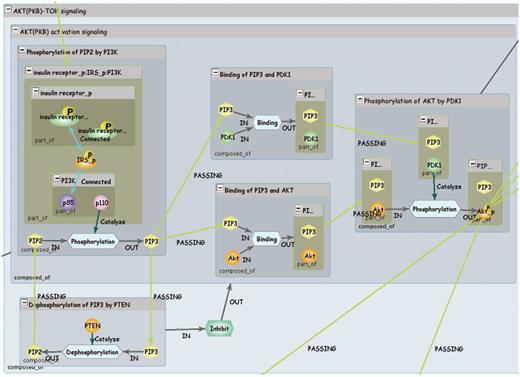
INOH pathway. Each blue window represents event of different granularity, and green window represents molecular complex. Light blue hexagons are Process nodes that show molecular interactions, and green hexagon is EventRelation node that shows positive/negative indirect relation between events.
INOH interactions are shown using a Process node, so it is expressible that multiple inputs, multiple controllers and multiple outputs are mediated by one process. In addition, the indirect relations between events are also supported in the INOH database. For example, if an event regulates a pathway/subpathway positively or negatively, the controller event and the controlled event are connected via an EventRelation node. Like Process nodes, this presentation permits two events to cooperatively control the other events. Since the INOH database provides a static pathway data captured from publications, it is difficult to represent quantitative relationships that are changed under different environment. However, representation of relations among two or more events is a unique feature of the INOH database. The event-centric model allows a flexible representation of signal transduction, a close translation from the context of scientific literature.
All kinds of nodes and edges in the INOH pathway have distinct properties, which can be changed for each pathway object, and these nodes are annotated by a set of uniquely developed ontologies, as described below.
Annotation by ontologies
The INOH database provides a set of uniquely developed ontologies designed for pathway annotation, because many existing ontologies including Gene Ontology (GO) (15) is designed for annotating gene function. Our ontologies are used to annotate appropriate types or attributes of objects in a pathway (Table 2). Each ontology is arranged in a hierarchical structure using OBO-Edit (16), and the knowledge is extracted from the scientific literature by manual expert curation. Each ontology term has attributes, such as a definition with literature reference(s) (e.g. PubMed), external ID links [UniProt (17), KEGG, Gene Ontology (GO), PSI-MI, and Sequence Ontology (SO) (18)], and synonyms. In these ontologies, there are several relationship types such as ‘is-a’, ‘part-of’, ‘sequence-of’ and ‘regulates'.
| Ontology . | Number of entries . | Number of xrefs . |
|---|---|---|
| MoleculeRole version.2.24 2011/03/22 | 9217 | UniProt ACs 5868 |
| GO IDs 347 | ||
| InterPro ACs 32 | ||
| KEGG compound IDs 588 | ||
| PubMed IDs 160 | ||
| Event version.1.72 2011/03/22 | 3828 | GO IDs 539 |
| KEGG reaction IDs 618 | ||
| Reactome IDs 136 | ||
| PSI-MI IDs 71 | ||
| Location version.1.02 2011/03/22 | 52 | GO IDs 49 |
| Process version.1.04 | 101 | PSI-MI IDs 71 |
| GO IDs 12 | ||
| EC numbers 33 | ||
| GenomeSequence version.1.00 | 57 | SO IDs 33 |
| EventRelation version.1.11 | 12 |
MoleculeRole Ontology for protein/chemical compounds, Event Ontology for pathways/subpathways, Process Ontology for molecular interactions, Location Ontology for cellular localization, GenomeSequence Ontology for DNA/RNA sequences, EventRelation Ontology for correlation between pathways/subpathways.
| Ontology . | Number of entries . | Number of xrefs . |
|---|---|---|
| MoleculeRole version.2.24 2011/03/22 | 9217 | UniProt ACs 5868 |
| GO IDs 347 | ||
| InterPro ACs 32 | ||
| KEGG compound IDs 588 | ||
| PubMed IDs 160 | ||
| Event version.1.72 2011/03/22 | 3828 | GO IDs 539 |
| KEGG reaction IDs 618 | ||
| Reactome IDs 136 | ||
| PSI-MI IDs 71 | ||
| Location version.1.02 2011/03/22 | 52 | GO IDs 49 |
| Process version.1.04 | 101 | PSI-MI IDs 71 |
| GO IDs 12 | ||
| EC numbers 33 | ||
| GenomeSequence version.1.00 | 57 | SO IDs 33 |
| EventRelation version.1.11 | 12 |
MoleculeRole Ontology for protein/chemical compounds, Event Ontology for pathways/subpathways, Process Ontology for molecular interactions, Location Ontology for cellular localization, GenomeSequence Ontology for DNA/RNA sequences, EventRelation Ontology for correlation between pathways/subpathways.
The INOH MoleculeRole Ontology is a hierarchical ontology, which contains the molecular functional group, abstract molecule and concrete molecule names manually collected from literature. This classification is based on a conceptual classification of molecular roles in protein interaction and signal transduction rather than sequence similarities (6). Generally, the number of mid-class ontology terms, such as ‘Wnt’ and ‘JAK’, is insufficient on other ontologies such as KEGG Orthology (KO) (13), Protein Ontology (19) and GO. These terms are indispensable for annotating canonical pathways based on review articles. The reusability of ontology terms between more than one pathway is important for the manual curation process of a pathway database, especially if it is developed by distributed co-curation processes. Thus, we can manage all pathway data unitarily and consistently and provide integrated pathway data such as cross-talk or other relations between pathways.
The Event Ontology (7) is a pathway-centric complement to the biological process ontology in the GO, and includes the following concepts; interactions (e.g. binding), subpathways (e.g. binding of Smad3 and PIASy), pathways (e.g. Wnt signaling) and their related biological phenomena (e.g. cell growth) in pathway data. Since the GO does not thoroughly manage the relations among subpathways and pathways and its set terms are too large and exhaustive for annotation of the pathway components, it is not enough to annotate for pathway data. The Event Ontology covers (i) classification of molecular interactions, (ii) relations between pathways and subpathways, (iii) relations between pathways and biological phenomena, (iv) classification of subpathways based on molecule names (MoleculeRole Ontology) and (v) relations between subpathways and regulated pathways. What ‘event’ is also annotated with controlled vocabularies produces several important benefits. For example, terms such as ‘internalization’, ‘import’, ‘transport’ and ‘secretion’ are used to represent the translocation of molecules. The definitions of these vocabularies and relations are recorded in the Event Ontology, which makes it easier to understand that ‘Nuclear import of JNK’ and ‘Nuclear translocation of JNK’ is the same reaction as ‘Translocation of JNK from cytosol to nucleus’ in the JNK signaling pathway. This simplifies retrieval by the system of all translocation-related reactions.
The Location Ontology is a GO cellular component-based ontology for annotating a molecule's cellular localization. Specifically, the location around the membrane is so important for signal transduction pathways that it is defined sensitively [e.g. cilium membrane (integral to membrane), caveola (extrinsic to membrane)].
The MoleculeRole Ontology and the Event Ontology files are downloadable from not only our web site, but also the Open Biological and Biomedical Ontologies (OBO) (20), NCBO BioPortal (21) and BRENDA Ontology Explorer (22). These data are also accessible on the Web through the Ontology Lookup Service (23) and our INOH Ontology Viewer web application (http://www.inoh.org/ontology-viewer) (Figure 3).
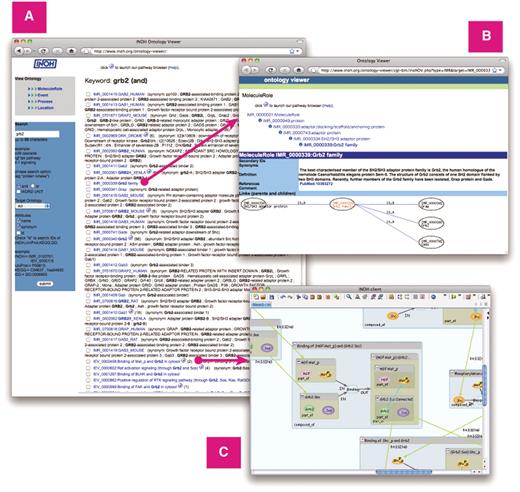
Screenshot of Ontology Viewer. (A) Example of search result. (B) Attribute and ontology hierarchy view. (C) Example of INOH pathway data accessed through INOH Ontology Viewer.
INOH curation
Our pathways are created using the INOH Client Tool by the INOH curators who have a biological background. The INOH Client Tool has a strict error check function to minimize the chance of mistakes. And to ensure consistency across different curators, our pathway data is well-annotated by the INOH ontology terms. After curation, multiple curators and system engineers check the consistency of data, and then the file is uploaded onto the INOH server.
We usually choose the canonical pathways that are described in detail at the molecular level in several review articles for curation. We have also collected the species-specific and molecule-specific pathways related to the canonical pathways. They are linked by HomologousEvent edge and MolecularVariation edge, respectively, in the INOH model. All were collected from literature by manual curation, not including computationally inferred pathways. KEGG pathway maps are manually drawn reference pathways collected from published literature. Organism-specific pathway maps can be computationally generated by correlating genes in the genome with gene products in the reference pathways. Each protein–protein interaction does not have a literature reference, so we cannot determine whether one actually exists. Reactome is a major, useful pathway resource, which includes peer-reviewed, manually curated human pathways and electronically inferred pathways in 22 non-human species using protein similarity. Other Reactomes, such as Arabidopsis Reactome (24) and FlyReactome (http://fly.reactome.org/), are currently available. Although they provide species-specific pathway resources curated from literature, there is no link between the human Reactome. For example, ‘Phosphorylation of phospho-(Ser45) at Thr 41 by GSK-3’ in Reactome (REACT_9955.1) and ‘Further phosphorylation of ARM by SGG’ in FlyReactome (REACT_16250.1) are homologous events in the INOH data model.
Each INOH molecule contains information about its post-translational modifications (PTMs), its cellular localization and its binding sites. This molecular information is also supported by one or more literature references as well as that attached to all events (Table 1).
Currently, we provide 73 signal transduction diagram files including 59 canonical-, 5 Mammalia-, 1 Mus musculus-, 2 Xenopus laevis-, 10 D Drosophila melanogaster-, and 5 Caenorhabditis elegans-curated pathways. We also provide 29 human metabolic pathway diagrams collected manually from textbooks. They include 857 subpathways, 6155 interactions, and 3395 proteins (Table 1). All pathway data in the INOH database are downloadable in INOH XML and BioPAX formats at http://www.inoh.org/download.html. Due to the small-scale, manual curation, the newly curated and updated data is released once or twice a year. We update the released data, especially black-box events. For example, the event ‘IKK activation signaling (through PKC theta and CARMA1:BCL10:MALT1)’ was formerly represented as a closed event node. Now it has been updated as the event composed of six subevent according to newly published articles.
INOH applications
INOH Ontology Viewer
INOH Ontology Viewer (http://www.inoh.org/ontology-viewer) is a web application, which allows user to browse and search ontology by names, synonyms and IDs of INOH, UniProt, KEGG and GO (Figure 3). By clicking search result, new window appears in which user can see value of each attribute and where term is located in ontology hierarchy. By clicking parent or child node of graph representation below attribute, another new window appears that shows that node in centre. User can access INOH pathway data through INOH Ontology Viewer. By clicking icon near ontology term, the INOH Client under Java Web Start starts and displays pathway data annotated with selected ontology term.
INOH Client tool for pathway navigation
INOH pathway data can be queried and represented graphically through the INOH Client tool, which is a pathway navigation/editor tool for editing and searching pathways in the INOH database and provides an automatic layout function of compound graph pathways. The INOH Client is downloadable from our website. A user can query the INOH database for pathways and pathway objects by specifying molecule names, biological process names or INOH object IDs (IDs of UniProt, GO and any other databases are not acceptable) (Keyword or ID Search) (Figure 4). For example, the keyword ‘TGF’ results in 8 Diagram [e.g. TGF-β signaling (through TAK1)], 60 Event (e.g. Binding of TGF receptor complex and R-Smad), 330 Material (e.g. TGF-β receptor I) hits. The participant match of the result list means that the child object on the compound graph contains the keywords.
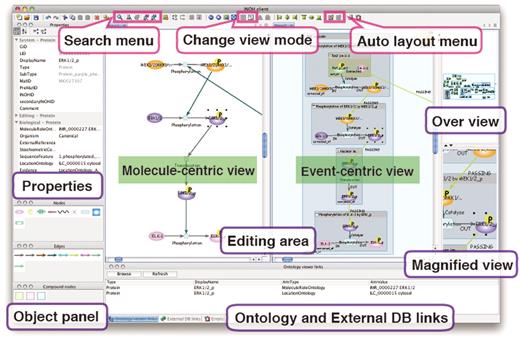
Screenshot of INOH Client. Window consists of five areas; tool panel (Objects and Properties panels), diagram editing area, over view area, magnified view area and external DB links area. User can search and download pathways, and pathways can be then modified and saved. When switching from normal view to reduced view in toolbar, picture focusing on molecular transition is displayed in diagram editing area.
Furthermore, the INOH Client tool enables pathway expansion by retrieving events connected to the user's specified event (Pathway Retrieval). It allows the user not only to browse the defined pathway, but also to create novel pathways. For example, a user searches the following events of ‘Nuclear import of Smad1:Smad4’ in BMP2 signaling. The event is a candidate when the input molecules of that event have the same MoleculeRole ontology as the output molecule ‘Smad1’ or ‘Smad4’ of the event ‘Nuclear import of Smad1:Smad4’. Next, the user chooses ‘Canonical Wnt signaling pathway Diagram’ and ‘LIF signaling (JAK1 JAK2 STAT3)’ from the candidate list and pastes them on the canvas with BMP2 signaling. Then the ‘PseudoPASSING’ edges for the possible anteroposterior relation are generated automatically, and the cross-talk between pathways is indicated graphically (Figure 5). Merging and displaying separate pathways containing the same events is a unique feature. A user can also search positive and negative regulations of events, 'species-specific' pathways/events related to the canonical pathway/event (Figure 6), 'molecular variation' pathways/events related to the generic pathway/event.
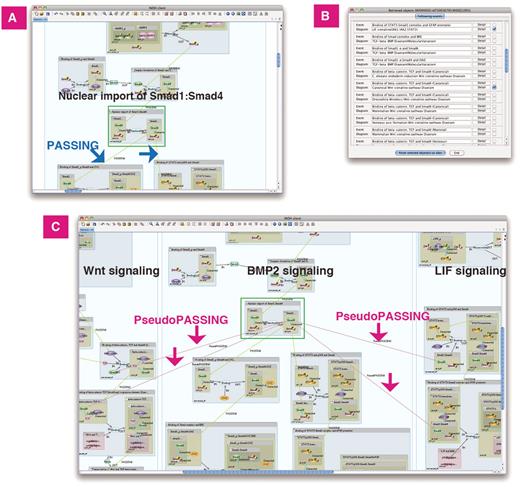
Previous/following event search. BMP2 signaling does ‘cross-talk’ with Wnt and LIF signaling. (A) Search following events of ‘Nuclear import of Smad1:Smad4’ in BMP2 signaling. The curated following events are connected to the event by the PASSING edges. (B) List of following events and its diagram. (C) Wnt and LIF signaling is pasted on same canvas. The inferred following events are connected by the PseudoPASSING edges.
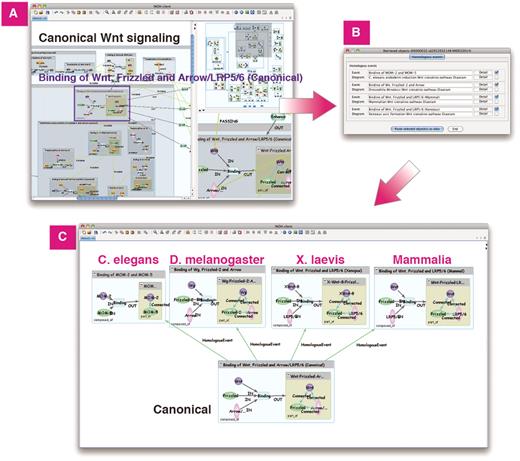
Homologous search in Wnt signaling. (A) Search homologous events of ‘Binding of Wnt, Frizzled and Arrow/LRP5/6 (Canonical)’ in Wnt signaling. (B) List of homologous events and its diagrams. (C) Homologous events in C.elegans, D.melanogaster, X.laevis and Mammalia can be pasted on same canvas for comparison.
Similarity search in INOH with ontological support
We developed a prototype web tool that accepts a graph query, whose nodes and edges are proteins and their relations, respectively, or ‘Event’ and their connections, respectively, and searches the pathway/network data for similar subgraphs on the INOH database (Similarity Search). The subgraphs matching to the query were ordered by their similarity scores. The similarity score (evaluation value) of each subgraph was calculated from semantic distance of INOH ontology terms and insertion and deletion of nodes and edges in a graph. The results may include unexpected pathways, such as pathways with similar functional molecules and partially conserved pathways between different species, due to searching up and down the INOH ontology's hierarchy. These pathways will not be obtained from the exact matching to the ontology terms or keywords.
For example, from the ‘Binding of EGL-17 and EGL-15’ in the FGF pathway (C.elegans), the following pathway groups are obtained; the homologous FGF pathways group (M.musculus, X.laevis, D.melanogaster), Canonical RTK pathways group (EGF, FGF, NGF, IGF, HGF, PDGF and VEGF pathways) and homologous RTK pathways group. The EGL-17 molecule (C.elegans) is a sibling to the FGF molecule (D.melanogaster) and a child of the FGF molecule (Canonical) in the MoleculeRole ontology. According to these ontological relationships and the graphical form including the interaction types, Similarity Search ranks similar pathways (Figure 7).
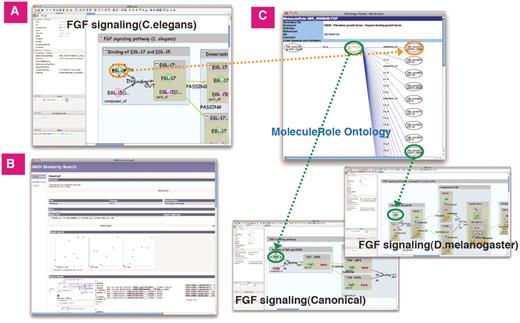
Similarity Search of FGF signaling (C.elegans). (A) The ligand-receptor binding in FGF signaling (C.elegans). (B) Result screen of similarity search. (C) The hierarchical tree of ‘FGF’ molecule in MoleculeRole ontology and some signaling pathways similar to FGF signaling (C.elegans). Green/orange edges represent correspondence relation to MoleculeRole ontology.
This system works under data annotated using the INOH ontology and based on the INOH format. It is necessary to be prepared for the subpathways that users freely create.
INOH APIs
The INOH database provides Simple Object Access Protocol (SOAP) web service Application Programming Interfaces (APIs). A user who wants to programmatically access INOH pathway data (INOH XML format) can do a keyword search and pathway retrieval search by using these APIs. Users can access the services through programming languages such as Perl, Python, Ruby and Java.
For example, a user can do a keyword search that specifies the node type and property, e.g. node type: ‘EventCompound’, property: ‘Organism’, keyword: ‘Drosophila’. The method and parameters can be found at the following website:
http://www.inoh.org/axis2/services/InohWebService2/ searchNodeByKeyword?param0=EventCompound¶m1=Organism¶m2=Drosophila¶m3=1¶m4=1¶m5=1 The output will be ‘II0000057:id1029784406:MI0014747’, for example. ID's pathways, e.g. ‘II0000057’ is the diagram id (Notch signaling pathway), can be displayed on the graphical user interface (INOH Client tool) under Java Web Start.
http://www.inoh.org/inohviewer/inohclient.jnlp? id=II00000057 Furthermore, by using two or more INOH APIs, the user can obtain more useful information. For example, a user can search all binding partners of phosphorylated proteins by using ‘searchNodeByKeyword’ and ‘searchBonding’ methods. First, a user can do a keyword search that specifies the node type and property, e.g. node type: ‘Protein’, property: ‘SequenceFeature’, keyword: ‘phosphorylated’. Second, search binding partners of the output by using ‘searchBonding’ methods. For more examples and information, please refer to the INOH API manual at the following website.
http://www.inoh.org/inoh_api_manual.html
Network analysis
Finally, we describe the use of the INOH database as a computational tool to aid in the interpretation of large-scale datasets. For analyzing a network, we used a human protein–protein network containing 25 proteins with SNPs related to acute allergic diseases and 70 interacting proteins, and 182 connections found by Renkonnen et al. (25) (Figure 8A).
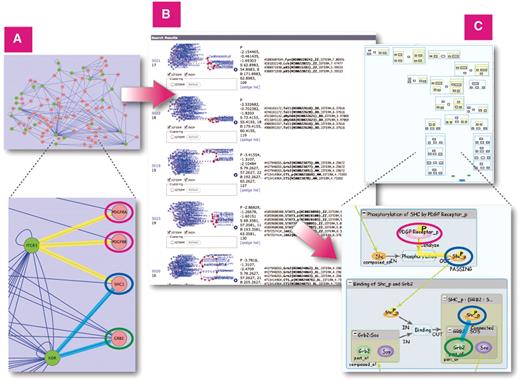
Similarity Search on all INOH pathways using large protein–protein network query. (A) Protein–protein network related to acute allergic diseases displayed in Cytoscape. (B) Results of similarity search on INOH pathways using network as query. (C) Example of INOH pathways that have similar molecules and interactions in protein–protein network dataset. Similar molecules and interactions are highlighted with same colors in (A) and (C). These results can be found here. http://www.inoh.org/similarity-search/project.php?session=1&pid=526.
First, we defined the INOH pathways most enriched in the above 95 proteins. Since the INOH database has no human signal transduction pathways except for metabolic pathways, we counted MoleculeRole Ontology (MRO) terms that include original human proteins in their child hierarchies. Table 3 lists the six most significant pathways: CD4 T cell receptor signaling; integrin signaling pathway; PDGF signaling pathway; Toll-like receptor signaling pathway; B cell receptor signaling; and HGF signaling pathway. They are biased toward immune cell signaling, and B cell receptor signaling and HGF signaling pathway have been also shown in the study with the Nature PID (25).
INOH pathways most enriched in proteins from allergy-related interaction network
| INOH pathway . | Number of MRO terms in pathway . | Number of MRO terms correspond to observed proteins . | Number of obsereved proteins . | Observed proteinsa . |
|---|---|---|---|---|
| T cell receptor signaling pathway | 69 | 18 | 15 | AKT1, IKKA, FOS, FYN, GRB2, LCK, MK08, NFKB1, P85A, KPCD, TAB2, RAC1, TF65, KSYK, TRAF6 |
| Integrin signaling pathway | 30 | 9 | 11 | FINC, FYN, GRB2, ITA5, ITB1, ITB3, MK08, FAK1, RAC1, SHC1, TENA |
| PDGF signaling pathway | 40 | 11 | 10 | AKT1, ETS1, GRB2, MK08, PGFRA, PGFRB, P85A, PTN11, PTN6, SHC1 |
| Toll-like receptor signaling pathway | 30 | 12 | 9 | CD14, IKKA, MYD88, NFKB1, TAB2, TF65, TLR2, TLR3, TRAF6 |
| B cell receptor signaling | 50 | 11 | 8 | IKKA, GRB2, NFKB1, P85A, TAB2, TF65, KSYK, TRAF6 |
| HGF signaling pathway | 26 | 7 | 8 | ETS1, GRB2, P85A, PTN11, PTN6, RAC1, SHC1, SRC |
aThe SwissProt names for proteins are used without the tag ‘_HUMAN’.
Next, we used the Renkonnen's protein–protein network dataset as a query to perform our Similarity Search. The search results included the Drosophila Toll and IMD pathways and canonical TNF/Fas pathway (apoptosis pathway) in addition to the pathways listed in Table 3. These pathways contain not only proteins, but also interactions that the query network has (Figure 8). Pathways in different species were also found using a hierarchy of the MoleculeRole Ontology.
Availability and components
The INOH Client is a free Java application that runs on Windows, Mac OS and Linux. It was built using yFiles (http://www.hulinks.co.jp/software/yfiles/) for drawing and laying out graphs and JIDE Software (http://www.jidesoft.com/) for providing a Java Swing Components.
Conversion to BioPAX
BioPAX is a standard language developed for integration, exchange, visualization and analysis of biological pathway data (2). BioPAX level 2 covers metabolic pathways, signaling pathways and molecular interactions. Level 3 also covers gene regulatory networks, genetic interactions, and states of molecules and generic molecules. INOH pathway data converted to level 2 and level 3 is provided freely.
The basic components of the INOH database roughly correspond to BioPAX level 2. However, since the INOH database deals with signaling pathway data including complex and detailed information, some features have no correspondence or are not exactly expressible in level 2. Thus, we recommend the use of our BioPAX level 3 conversion data rather than level 2. For example, the transcription and translation processes in the INOH database are mapped to the class ‘conversion’ in level 2, but they are mapped to the new class TemplateReaction in level 3 and the property ‘template’ is used in place of ‘left’. The new classes BindingFeature and ModificationFeature express molecular states in the INOH database in detail. BindingFeature can specify the binding domains of two entities in a complex that are bound to each other. A phosphorylated protein is mapped to the class Protein, and the property ‘feature’ point to the class ModificationFeature whose property ‘modificationType’ is assigned as ‘phosphorylated’.
The INOH pathway participant molecules, regardless of the level of granularity, correspond to a BioPAX level 3 PhysicalEntity class. The same molecules with different states refer to the same MoleculeRole Ontology, corresponding to the EntityReference class in BioPAX level 3. Whereas level 2 lacks the concept equivalent for the generic molecule in the INOH database, level 3 has the new property memberPhysicalEntity/memberEntityReference to specify a set of entities.
Since the INOH database has many more pathway descriptions than that of typical databases (Table 1), an abstract indirect interaction between events, the relation between 'species-specific' or 'molecule-specific' pathways and the canonical pathways (generalization of events), cannot be mapped to the BioPAX class. While the INOH molecule has three types of evidence for its PTMs/binding sites, cellular localization and general information, the BioPAX PhysicalEntity class has only one type of evidence for general information. Therefore, our BioPAX conversion file loads an INOH extension ontology to add our original properties to BioPAX class via OWL's import mechanism.
There are many BioPAX-compatible software programs, such as Protégé (http://protege.stanford.edu) and Cytoscape (26), for pathway data analysis and visualization. There is also the Paxtools Java programming library (http//:www.biopax.org/paxtools/) for software developers. Paxtools has been developed for accessing and manipulating data in BioPAX format. Software tools that use BioPAX, such as exporters, importers, analysis algorithms or editors, can use Paxtools as their core BioPAX API. We developed the persistency layer of Paxtools.
Conclusions and perspective
The INOH database is a highly structured, manually curated database of signal transduction pathways. The Similarity Search using the combination of a graph and hierarchical ontologies is the most unique feature that other databases or ontologies have never achieved. We demonstrated the prediction of pathways related to a user-defined protein network. As users can edit and save their own pathways, the INOH Client tool is now served both as editor tool and query tool. We have to separate these to avoid confusion. Furthermore, downloading and installing the INOH Client tool are not the best way for users. We will update our web interface in the future to allow users to easily access all the pathways and search functions instead of the INOH Client. However, we believe that our well-annotated data are a good resource for many users who want to analyze a large protein network.
Although many projects, including INOH, make efforts to curate pathway information into a biological database, a large amount of knowledge about cellular signaling resides in scientific literature and new insights are generated everyday. To avoid duplication and reduce curating costs, many databases may share their pathway data. Therefore, we have to keep our pathway resource freely available in BioPAX or other emerging pathway exchange formats. We encourage other pathway database groups to make use of more computer-readable pathway data models, such as INOH, as well as to reuse useful ontologies listed in OBO including INOH MoleculeRole and Event ontology for pathway annotation.
To accelerate data input, WikiPathways (27) tries to provide a web-based format for submission pathway information by individual researchers. In addition, ConsensusPathDB (28) and Pathway Commons (http://www.pathwaycommons.org/) provide convenient single points of access to biological pathway information integrated from multiple public pathway databases. All the above studies are working toward a complete representation of cellular signaling into a computable form.
Funding
Institute for Bioinformatics Research and Development (BIRD) of Japan Science and Technology Agency (JST). Funding for open access charge: Graduate School of Frontier Sciences, The University of Tokyo.
Conflict of interest. None declared.


